Bit by Bit: Social Research in the Digital Age

bigdata

Pic by Jim Kaskade (flickr creative commons)

Matthew Salganik, Professor of Sociology at Princeton University, has recently put his forthcoming book on social research and big data online for an open review. Matthew is the author of many of my favorite academic works, including this experiment in which he and Duncan Watts test social influence by artificially inverting the popularity of songs in an online music market. He is also the brains behind All Our Ideas, an amazing tool that I have used in much of the work that I have been doing, including “The Governor Asks” in Brazil.

As in the words of Matthew, this is a book “for social scientists that want to do more data science, and it is for data scientists that want to do more social science.” Even though I have not read the entire book, one of the things that has already impressed me is the simplicity with which Matthew explains complex topics, such as human computation, distributed data collection and digital experiments. For each topic, he highlights opportunities and provides experienced advice for those working with big data and social sciences. His stance on social research in the digital age is brilliant and refreshing, and is a wake-up call for lots of people working in that domain. Below is an excerpt from his preface:

From data scientists, I’ve seen two common misunderstandings. The first is thinking that more data automatically solves problems. But, for social research that has not been my experience. In fact, for social research new types of data, as opposed to more of the same data, seems to be most helpful. The second misunderstanding that I’ve seen from data scientists is thinking that social science is just a bunch of fancy-talk wrapped around common sense. Of course, as a social scientist—more specifically as a sociologist—I don’t agree with that; I think that social science has a lot of to offer. Smart people have been working hard to understand human behavior for a long time, and it seems unwise to ignore the wisdom that has accumulated from this effort. My hope is that this book will offer you some of that wisdom in a way that is easy to understand.

From social scientists, I’ve also seen two common misunderstandings. First, I’ve seen some people write-off the entire idea of social research using the tools of the digital age based on a few bad papers. If you are reading this book, you have probably already read a bunch of papers that uses social media data in ways that are banal or wrong (or both). I have too. However, it would be a serious mistake to conclude from these examples that all digital age social research is bad. In fact, you’ve probably also read a bunch of papers that use survey data in ways that are banal or wrong, but you don’t write-off all research using surveys. That’s because you know that there is great research done with survey data, and in this book, I’m going to show you that there is also great research done with the tools of the digital age.

The second common misunderstanding that I’ve seen from social scientists is to confuse the present with the future. When assessing social research in the digital age—the research that I’m going to describe in this book—it is important to ask two distinction questions:

How well does this style of research work now?

How well will this style of research work in the future as the data landscape changes and as researchers devote more attention to these problems?

I have only gone through parts of the book (and yes, I did go beyond the preface). But from what I can see, it is a must read for those who are interested in digital technologies and the new frontiers of social research. And while reading it, why not respond to Matthew’s generous act by providing some comments? You can access the book here.


Democratic Distributions

Gaussian, Poisson, and other bell-shaped distributions are some times called “democratic.” This colloquial term is intended to indicate an important feature: an average value is a typical value.

Compare this to heavy-tailed distributions which follow generally the so-called 80/20 rule: 80% of your business comes from 20% of your clients, 80% of the wealth is controlled by 20% of the population. Indeed, this principle was originally illustrated by Italian economist Vilfredo Pareto when he demonstrated that 80% of the land in Italy was owned by 20% of the population.

In these distributions, an average value is not typical: the average household income doesn’t mean much when a small group of people are vastly more wealthy than the rest. This skew can be shown mathematically: in a bell curve, the variance – which measures the spread of a distribution – is well defined, while it diverges for a heavy-tailed distribution.

Yet while heavy-tailed distributions are clearly not democratic, I’m still struck by the use of the term for normal distributions. I’m not sure I’d call those distributions democratic either.

I’m particularly intrigued by the use of the word “democratic” to nod to the idea of things being the same. Indeed, such bell-shaped distributions are known primarily for being statistically homogeneous.

That’s starting to border on some Harrison Bergeron imagery, with a Handicapper General tasked with making sure that no outliers are too intelligent or too pretty.

That’s not democratic at all. Not really.

This, of course, leads me to the question: what would a “democratic” distribution really look like?

I don’t have a good answer for that, but this does raise an broader point about democracy: most real-world systems are heavy-tailed. Properties like hight and weight follow normal distributions, but power, money, and fame are heavy-tailed.

So the real question isn’t what a democratic distribution looks like; it is how do we design a democratic system in a complex system that is inherently undemocratic?

facebooktwittergoogle_plusredditlinkedintumblrmail

New Video, “Re-imagine the Future”

When faced with the massive crises of our time, the most logical response is paralysis.  What can an individual possibly do about something so massive and complex?

But what if people could manage to imagine changes that matter within their own lives, and then to grow and federate them? My colleague Anna Grear, a law professor at Cardiff University, and I wanted to focus on some of the positive, practical steps that anyone can take in dealing with the terrible challenges of our time.  

One result is a six-minute video that we are releasing today. The video is based on a series of interviews with participants in a June workshop called “Operationalising Green Governance.”  Held at a lovely retreat center north of Paris, a handful of participants – international law professors, human rights advocates, activists – were interviewed on camera by Ibby Stockdale, Director of a British film production company, Five Foot Four.  Ibby brilliantly distilled hours of interview footage and crafted a succinct, beautifully produced message. 

The short film, “Re-imagine the Future,” is now posted online and can be watched here.

In six minutes, it’s difficult to cover too much ground – so in the closing frames of the film, we provide links to two dedicated webpages – Anna’s  and mine -- to provide resources, organizations, essays, books, etc. for those interested in exploring the film’s themes more deeply. 

We hope you like the film – and would welcome whatever pass-along visibility you can give it.

read more

three ways of thinking about fluctuations in polls

With the national presidential polls suddenly looking very tight, here are three ways of looking at the state of the election.

  1. An election is like a race. As in a race, the contenders stand in some relation to each other at any given moment. They can increase or reduce their speeds, but it’s an advantage to be in front, and more so as time passes. If an election is like a race, then it becomes increasingly important who’s ahead as the finish line approaches. A race course may have features that favor one or the other contender at a given moment. For instance, each presidential candidate gets a burst of speed after her or his convention, and a debate offers a chance for one of them to speed up or stumble, but the last stretch will be pretty level and even. In that case, it is bad news for Clinton that her lead had dissipated as we’ve moved through September. Much depends on whether that trend continues or reverses in the next few weeks, because by mid-October, a candidate who trails has little time to make up the gap. (That conclusion follows from the race metaphor.) It supports the idea that Trump has as much as a 40% chance of winning.
  2. An election is an event that occurs at one moment (although kind of a stretched-out moment nowadays, thanks to early voting). Polls ask people how they will vote once the big moment comes. It’s not clear when our predictions are most accurate, and accuracy may not necessarily increase over time. Instead, we might think of each of the many hundreds of polls taken so far as a measure of how the public will vote once the actual election comes. The best estimate, from this Bayesian perspective, averages all the polls taken so far. It does so not only to maximize the sample size but also to negate the random variations in competitors’ standing due to recent events. As Sam Wang says, “I still expect Clinton’s lead to increase again, on the grounds that she has led all year. Previously, I noted that the national Clinton-vs.-Trump margin in 2016 has averaged 4.5 percentage points. The standard deviation is 2.2 points, comparable to the four Presidential elections from 2004 to 2012. … Today, conditions seem right for regression to the mean.'” There is no such thing as regression to the mean in a race, where the leader accumulates an increasing chance of winning. But this second way of thinking about the election avoids the race analogy. Wang‘s own Bayesian prediction is a little more complicated, but it gives Trump only a 14% chance of winning.
  3. An election is an event that will happen at one moment in the future, and each poll is a prediction of what will happen when that moment comes–but the sample that responds to pollsters varies depending on recent events. Democrats, for instance, may have become marginally less likely to answer surveys in the last two weeks because of some generalized discouragement–or Republicans who were going to vote for Trump all along may have become more willing to answer the pollsters’ calls. If this theory applies, I think we should act as Wang recommends, because we should treat the variations in response rates as pretty random. But we might view the real vote as similar to a single poll and ask whether the experience of actually voting will encourage or discourage the people who have been favorable to Clinton or to Trump all along. We cannot tell the answer to that question from poll data, but we might propose reasonable hypotheses about it.

Since I don’t know which of these theories is true, I’m inclined to estimate the odds of a Clinton win somewhere between the Bayesian estimate (86% or so) and the horse race estimate of only about 60%.

Learn How to Apply for a Nevins Fellow on 9/21 Confab Call

As we recently announced, NCDD is hosting a special Confab Call this Wednesday, September 21st from 12-1pm Eastern / 9-10am Pacific with the McCourtney Institute for Democracy. This call is the best place to learn how to apply for the amazing opportunity to have a D&D-trained student fellow come work with your organization at no cost and make sure your application is successful, so we strongly encourage our NCDD member organizations to register todayConfab bubble image

During the Confab, McCourtney’s Senior Scholar John Gastil and Managing Director Christopher Beem will provide an overview of their Nevins Democracy Leaders Program, which ­trains college students in D&D and transpartisan leadership skills and then fast tracks them into related careers through placing them in Fellowship positions with leading organizations in the field. Becoming a Nevins host organization is the perfect way to cultivate and prepare the next generation of young D&D leaders while helping your organization build capacity, and this call will be the best place to learn how you can have the best shot at being matched with a Nevins Fellow through their competitive application process.

The call will be full of information and pointers about how to apply for a Fellow, plus it may even feature insights and reflections from past Nevins Fellows on what the experience was like for them. The application will open shortly after the call, but participants in this Confab will have the inside track, so don’t miss this great opportunity! We look forward to talking more with you on the call.

how schools teach about political parties

According to a new paper released today by CIRCLE:

  • Forty-three states require students to learn about political parties; however, the language in the standards nearly always promotes a simplistic understanding of the role that political parties play in a democracy.
  • Only eight states ask students to study the ideological underpinnings of the two major political parties.
  • Only 10 states ask students to study controversial political issues and their relationship to political parties.
  • There is very limited support for learning about political ideology. When states do include language about ideology, it is most commonly mentioned in history/social studies standards and very rarely linked to contemporary political parties.

“This generation has grown up in a vitriolic and polarized political climate. In order to sort through the noise, young people need to have a deep understanding of the ideological values that divide us and how those values do, and do not, map onto political parties,” reports Paula McAvoy, lead author of the study and program director for the Center for Ethics and Education at UW-Madison, who completed this study with Rebecca Fine and Ann Herrera Ward.  “Our team’s findings show that state standards stop short of asking students to make meaningful connections between partisanship, ideology, and the issues of the day.  If schools are to fulfill their mission of preparing young people for political participation, teachers need to be encouraged to bring these ideas into the classroom.”

“Understanding what major political parties are and what they stand for is essential in navigating politics and elections in the U.S., but very little support exists.  These findings emphasize the need to strengthen standards and support teachers in U.S. civic education,” said Kei Kawashima-Ginsberg, Director of CIRCLE. “Encouraging this type of learning about politics, elections and voting is a major reason why we are collaborating with other organizations to support teachers during this election year via the Teaching for Democracy Alliance.” For more on this Alliance see here.

For CIRCLE’s full briefing, please see here or the interactive map here. More research and background on youth civic education can be found on CIRCLE’s Quick Facts on Civic Education page.

CIRCLE’s 2016 Election Center will continue to offer data products and analyses providing a comprehensive picture of the youth vote, including the Youth Electoral Significance Index, which offers insight into key states where young people have the potential to shape the 2016 general election.

Gestalt Principles

In Parts I and II of Gestalt Principles, Bang Wong describes core elements of Gestalt psychology, a 1920s German theory of “how people organize visual information.” The German term Gestalt means shape or form. As Wong summarizes in Part II, “our visual system attempts to structure what we see into patterns to make sense of information.” In other words, we naturally and reflexively process visual input by attempting to group objects into “unified wholes.”

In Part I, Wong explores the principles of similarity, proximity, connection and enclosure. “The fundamental concept behind these principles is grouping;” he argues. “We tend to perceive objects that look alike, are placed close together, connected by lines or enclosed in a common space as belonging together.” Color schemes, visual clustering, and lines on a graph are all tools which can differentiate datasets.

In Part II, he examines the principles of visual completion and continuity:  “Because we have a strong tendency to see shapes as continuous to the greatest degree possible, we fill in voids with visual cues found elsewhere on the page.” This principle has an important implication: “every element on a page affects how we perceive every other element.”

Wong presents all these principles as helpful design tools which can leverage human mental processing in order to present data clearly.

What’s missing from these short essays, however, is any discussion of possible misuse of these design principles. Presumably, an altruistic designer would solely use these tools to “let the data speak for itself;” using Gestalt principles to highlight and clarify the ground truth which is already there.

But this seems to gloss over an important detail: all design choices are choices. Even putting aside the occasional malicious designer, who deliberately presents a warped visualization in order to leave viewers with an erroneous impression; it seems entirely possible that a lazy designer could accidentally imply something unintended, or that a researcher could be mislead by the Gestalt of their own visualization.

Furthermore, while these principles may be the simplest way to communicate data, there is no discussion of whether they are the right way to communicate data.

Last semester, Lauren Klein of Georgia Tech gave a talk at Northeastern in which she highlighted the visualization work of Elizabeth Peabody. Remembered primarily as an educator, Peabody created of elaborate mural charts of history, intended to provide historic “outlines to the eye.” Her work was intentionally complex and difficult to engage with; people had to interact with it to understand it. In the mid-1800s, this approach pushed the question who is authorized to produce knowledge? And subversively answered: everyone.

So Gestalt principles may make it easier to process information, but it should also be acknowledged that this may diminish the agency of the viewer – whose brain reflexively interprets visual stimuli in a given way, even if it’s not accurate and even if they know it’s not accurate.

At the beginning of the two articles, Wong quotes founding Gestalt scholar Kurt Koffka, in saying “The whole is ‘other’ than the sum of its parts.” While this is sometimes translated as “greater than the sum of its parts,” Wong is clear that this was not Koffka’s meaning: “the emergent entity is ‘other’ (not greater or lesser) than the sum of the parts.”

This quote highlights the need to think more robustly of the experience of the viewer. The design that is created, the visualization that expresses some aspect of the data, is a new thing, other than what existed before. Peabody’s visualizations were exhaustingly interactive, but they did invite the viewer to become an active participant in the act of creating this other.

facebooktwittergoogle_plusredditlinkedintumblrmail

Resources for Constitution Day and Freedom Week

sips-11

Here in Florida, we are required by state statute to teach about the important documents of this country during Freedom Week at the end of September. This is in addition to what is expected for Constitution Day. Over the past year, the Florida Joint Center for Citizenship, in collaboration with teachers and leaders from some counties and with the National Archives, has been working on a new set of lessons and materials that include primary sources. We wrote about this effort here. We are happy to announce that as of this week, we have a number of new lessons that target grades 2-12 and are intended to help teach our state benchmarks that can be connected to Freedom Week and Constitution Day!   You do, of course, need to register on our main site in order to access these new free resources. You can visit each lesson directly from the links below. Each one is intended to give students some hands on experience with primary sources and everything you need for instruction is provided for you (though you do need to use your own technology!).


Thinking Through Timelines: Inching Toward Independence

A Short Activity for Second Grade

Question: Why do we celebrate Independence Day?

Thinking Through Timelines: Creating the Constitution

A Short Activity for Third Grade

Question: Why do we celebrate Constitution Day?

Guidance on Government: State Edition

A Short Activity for Fourth Grade

Question: How does the Florida Constitution organize the government?

Guidance on Government: Federal Edition

A Short Activity for Fifth Grade

Question: How does the U.S. Constitution organize the government?

Decoding the Declaration, Celebrate Freedom Week Part I

A Short Activity for High School and Middle School

Question: What did declaring independence say about the importance of rights?

Intentions for Independence, Celebrate Freedom Week Part II

A Short Activity for High School and Middle School

Question: Were the colonists justified in declaring independence?

Rhetoric of Revolution, Celebrate Freedom Week Part III

A Short Activity for High School and Middle School

Question: How does language intensify the message of the Declaration of Independence?

Forward to the Future, Celebrate Freedom Week Part IV

A Short Activity for High School and Middle School

Question: How are the ideas from the Declaration of Independence connected to our government today?

In addition to our original lessons, We have also created brand new lessons that feature the work of legendary cartoonist Clifford Berryman! These are intended to be used at the 6-12 level. 

Anyone Home?

A Short Activity for High School and Middle School

Question: How does this political cartoon illustrate the lawmaking process?

Picturing Separation of Powers

A Short Activity for High School and Middle School

Question: How do the political cartoons relate to the concept of separation of powers?

Suiting Up

A Short Activity for High School and Middle School

Question: How does this political cartoon illustrate the concept of checks and balances?


Why Attend the Florida Council for the Social Studies Conference in October?

We know that as teachers, you have a great many draws on your attention, but I want to encourage you to consider attending the Florida Council for the Social Studies state conference. The theme, ‘Survival in a Changing World’, is incredibly relevant to our work as social studies teachers in a climate that is increasingly divisive and difficult, and many of the sessions at the conference on that upcoming fine October weekend will provide you with ways to survive in this changing world.

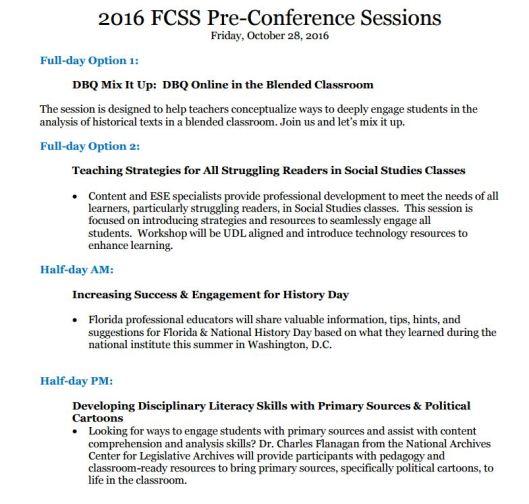
The Keynote Speaker on Saturday is Dr. Murali Balaji of the Hindu American Foundation. I personally have known Dr. Balaji for a number of years, and he is engaging and dynamic speaker. You can find out more about Dr. Bajali at our earlier post on his selection as the keynote. We also have some quality preconference sessions lined up to engage early arrivers! We are especially excited that we will be joined by both the DBQ Project and Dr. Charlie Flanagan of the National Archives for an excellent time!

precon

Another thing to think about, and this is VERY significant, is that this is an adoption year for social studies. You know what that means don’t you? It means that publishers will be all over the exhibit hall, and they will be VERY VERY VERY eager to make sure you sample their materials. There will, no doubt, be a great opportunity to get some free stuff and make some contacts!

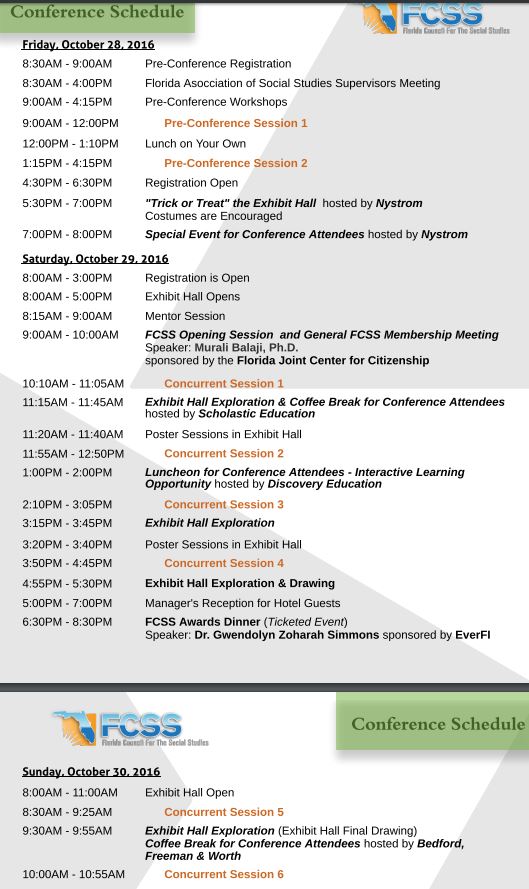
Speaking of the exhibit hall, on Friday night, Nystrom (yes, the same folks who put on that great dance at NCSS!) will be sponsoring a ‘trick or treat’ event in the exhibit hall. Dress up as a civic or historic figure or concept and get some free swag from folks in the hall. Shoot, you don’t even have to dress up! Just take part in the fun!

Sunday will be a day focused on Advanced Placement and meeting the needs of our colleagues that are dealing with some huge changes to both APUSH and AP World History. There will also be sessions available for all disciplines and grade levels. Dr. Stacy Skinner will be providing valuable information regarding the Social Studies End-of-Course Assessments.

CUFA-FL, under the leadership of UCF’s own Dr. Scott Waring, will also be hosting a number of good sessions led by leading social studies scholars. Well worth your time !

There are so many other reasons to attend the conference. The schedule of events is below, and the matrix and program will be available soon.  Please consider joining us this fall, especially if you are a new or pre-service teacher, and network with colleagues, make new friends, learn some stuff, and, most importantly, have some well-deserved fun! Register today! 

scehedulefcss