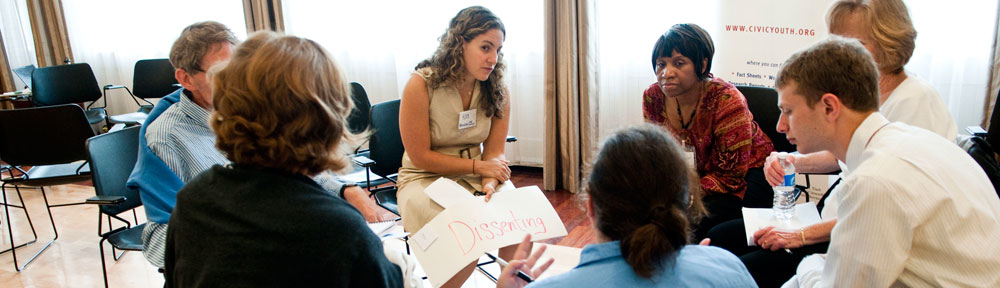

“Civic tech” broadly refers to the use of digital technologies to support a range of citizen engagement processes. From allowing individuals to report problems to local government to enabling the crowdsourcing of national legislation, civic tech aims to promote better policies and services – while contributing to more inclusive democratic institutions. But could civic tech affect public issues in a way that benefits some and excludes others?
Over the decades, the question of who participates in and who is excluded from participation mediated by technology has been the focus of both civic tech critics and proponents. The latter tend to argue that, by enabling citizens to participate without constraints of time and distance, civic tech facilitates the participation of those who usually abstain from engaging with public issues, leading to more inclusive processes. Critics argue that, given the existing digital divide, unequal access to technology will tend to empower the already empowered, further deepening societal differences. Yet both critics and proponents do tend to share an intuitive assumption: the socio-economic profile of who participates is the primary determinant of who benefits from digitally mediated civic participation. For instance, if more men participate, outcomes will favor male preferences, and if more young people participate, outcomes will be more aligned with the concerns of the youth.
In a new paper, we show that the link between the demographics of those participating through digital channels, and the beneficiaries of the participation process, is not necessarily as straightforward as commonly assumed. We review four civic tech cases where data allow us to trace the full participatory chain through:
- the initial digital divide
- the participant’s demographics
- the demands made through the process
- the policy outcomes
We examine online voting in the Brazilian state of Rio Grande do Sul’s participatory budgeting process, the local problem reporting platform Fix My Street (FMS) in the United Kingdom, Iceland’s online crowdsourced constitution process, and the global petitioning platform Change.org.
Counterintuitive findings
Change.org has been used by nearly half a billion people around the globe. Using a dataset of 3.9 million signers of online petitions in 132 countries, we examine the number of successful petitions and assess whether petitions created by women have more success than those submitted by men. Our analysis shows that, even if women create fewer online petitions than men, their petitions are more likely to be successful. All else equal, when online petitions have an impact on government policy, the agenda being implemented is much closer to the issues women choose to focus on.
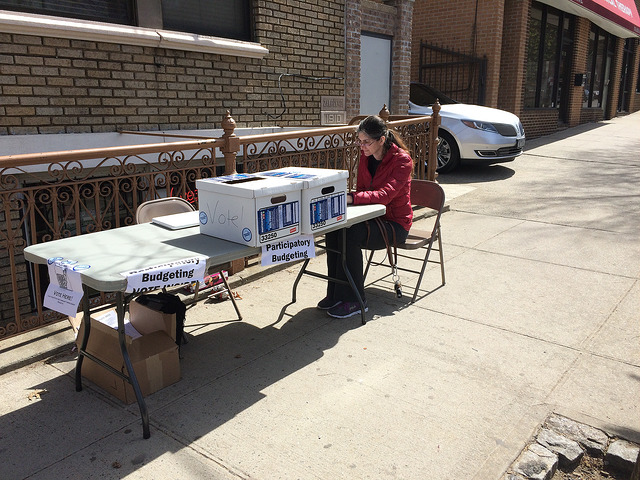
In Rio Grande do Sul’s digital participatory budgeting (PB), we show that despite important demographic differences between online and offline voters, these inequalities do not affect which types of projects are selected for funding – a consequence of PB’s unique institutional design, which favors redistributive effects.
In fact, of all the cases analyzed, none reflect the standard assumption that inequalities in who participates translate directly into inequalities in who benefits from the policy outcomes. Our results suggest that the socio-economic profile of participants predicts only in part who benefits from civic tech. Just as important to policy outcomes is how the platform translates civic participation into policy demands, and how the government responds to those demands. While civic tech practitioners pay a lot of attention to design from a technological perspective, our findings highlight the importance of considering how civic tech platforms function as political institutions that encourage certain types of behavior while discouraging others.
Civic tech, it seems, is not inherently good nor bad for democratic institutions. Instead, its effect is a combination of who participates on digital platforms and the choices of platform designers and governments.
***
Post co-authored with Jonathan Mellon and Fredrik M. Sjoberg. Cross-posted from the World Bank’s Let’s Talk Development blog.


 It’s been a while since the last post here. In compensation, it’s not been a bad year in terms of getting some research out there. First, we finally managed to publish “


