NBC Piece on Teaching Civics in a Tough Time

Good morning, friends of Civics and Social Studies! This was shared with me recently, and I thought you might appreciate it.

Tonight, on NBC Nightly News, a veteran of the Florida Joint Center for Citizenship‘s past Civics Mentor Teacher Program will be featured in a piece looking at teaching Civics during a contentious election season.  David Hamilton teaches at Pinellas Park Middle School, and the piece will look at the struggles and unique opportunities of teaching Civics during this overly contentious presidential election season. It should air tomorrow (Wed. 10/19) during the regular nightly news broadcast. The interview stems from a St. Pete Times article last year.

We are looking forward to the piece. David Hamilton is an excellent Civics teacher, and we are grateful to have worked with him in the past!


National Archives Berryman Webinar Coming Soon!

Friends in Social Studies, we are excited to announce that the Florida Joint Center for Citizenship has partnered with the National Archives Center for Legislative Archives to host a webinar around the legendary Clifford Berryman political cartoons! This webinar will be led by specialists from the National Archives, and is based in part on workshops that NARA’s fantastic Dr. Charles Flanagan has done in the past. Check out the description below, and please be sure to register! You will be sent a link to access the webinar prior to November 2.

Politics in Perspective: Teaching Elections Using the Cartoons of Clifford K. Berryman
Wednesday, November 2, 2016 at 4:30 p.m.ET

In this interactive webinar, discover how political cartoons can engage students in today’s elections by introducing the process and issues at a safe historical distance. Practice techniques for analyzing political cartoons in the classroom and learn about additional resources from the Center for Legislative Archives, part of the National Archives and Records Administration.
This webinar will last approximately one hour. Registration required.

berryman

We hope to ‘see’ you there! Questions on the webinar can be directed to me or to Ms. Val McVey, and we will be happy to answer them!


questions about happiness

We discussed the following questions in my first-year philosophy seminar last week, after having read selections from Plato, Nietzsche, Epicurus, Buddha, and Emerson, and before turning to J.S. Mill. They seem valuable prompts for personal reflection, too.

  1. Do we have a right to pay much attention to our own happiness? (Twenty-one children under the age of five die every minute because of preventable causes. Why are we spending 75 minutes talking about happiness in class while 1,575 kids die?) Do we have a duty to pay attention to our own happiness?
  2. To what extent can we affect others’ happiness? Which others? How?
  3. Does happiness require autonomy, or community, or both? (Can you be happy alone?)
  4. Is it best to aim for a high state of well-being (bliss, satisfaction, etc.) or rather strive to avoid bad mental states (suffering, despair)?
  5. Are there other outcomes for ourselves that we should seek instead of, or as well as, happiness? E.g., excellence, authenticity, dignity? (I leave aside justice to others as a whole topic unto itself.)
  6. Do we know whether we are happy? What kind of knowledge is that? Can we be wrong about it?
  7. Can you tell whether someone else is happy? What evidence is relevant? Could you be right and they be wrong?
  8. Is it possible to compare two people’s happiness on one scale?
  9. Should someone else’s happiness affect my happiness? Under what circumstances?
  10. For an individual, is there one scale from suffering to bliss, or are there many different continua?
  11. What are the behavioral consequences of happiness? Does happiness necessarily produce observable outcomes at all? Is happiness that does not produce any good outcomes nevertheless desirable?
  12. Are there beliefs about the world that promote happiness? (E.g., only the present is real; or everything happens for a reason.) Are these beliefs true? Does that matter?
  13. To answer, “What is happiness?” must we answer metaphysical and epistemological questions? (E.g., your view of happiness might be very different if a benign creator has created your immortal soul, as opposed to living in a universe in which life is suffering.) The answer might also be different if I can–or cannot–know whether I am happy.
  14. What is the relationship between truth and happiness? Let’s disaggregate the virtue of truth into sincerity, integrity (truth to who one is), and responsible inquiry. Let’s break down happiness into pleasure, peace, satisfaction, etc. What are the relationships among these things?
  15. Could being good (or just) to others be a path to happiness for ourselves? Is that a reason to be good? Is that the only reason to be good?

Celebrating What We Accomplished at NCDD 2016

bumper_sticker_600pxWe with the NCDD team want to say one more giant THANK YOU to all of those involved in making the 2016 National Conference on Dialogue & Deliberation an enormous success last weekend! It was without a doubt one of our best conferences yet, but it couldn’t have been as incredible as it was without you!

NCDD 2016 featured 5 pre-conference events, 54 workshops, 3 engaging plenaries, 3 mentoring sessions, over a dozen breakout discussions during our Networking & Collaboration space, a great field trip, and countless connections made. We also recorded several in-person interviews with NCDD members about the projects their working on which we’ll be turning into videos and podcasts soon. It felt like a whirlwind of wonderful people, good conversation, deep learning, and unlocked potential – you really missed out if you weren’t there!

NCDD is so grateful to the over 350 diverse innovators, practitioners, scholars, elected officials, and young leaders who attended this year’s conference, our tireless volunteers, our generous conference sponsors, our featured speakers, the mentors and mentees, and everyone else who worked to make NCDD 2016 so very special!panorama-smaller

Following up, Moving forward

While we certainly didn’t figure out how to bridge all of the divides that need healing over the weekend, we did share stories of how our field has already started that work, we gained insights on how we can grow and strengthen that work, and many collaborations, partnerships, and new projects were sparked during the gathering. We encourage all of our attendees to do the follow up and deeper connecting needed to make those collaborations and projects materialize.

To support our members in following up and to help those who couldn’t be there to stay connected, we created a conference Google drive folder, which we highly recommend that everyone check out – please add your notes, slides from your presentations, and other info to the folder for everyone to share! We also hope you’ll upload the best pictures you took to this folder so we can see all of the smiling faces of NCDD!

We also encourage you to keep the conversation going on social media with the hashtags #NCDD2016, #NCDD, #BridgingOurDivides, and #NCDDEmergingLeaders or by participating in our NCDD Facebook Discussion Group. Don’t forget to follow NCDD on Facebook and Twitter!

group-talkingNCDD conferences are always an in-person reminder of just how broad and powerful this field is. We are truly honored to be working to support our network and the important work you do. We will continue to share more in-depth updates on specific outcomes and next steps that emerged from the conference over the next weeks, so continue to check back here on the news blog for more.

For now, let’s bask in the great memories we made during this incredible gathering of our field while we make plans for advancing our work until the next time we all meet together in 2018!

state of the youth vote in 2016

CIRCLE has begun to release results from its survey of 1,605 Americans between the ages of 18 and 34. CIRCLE’s headlines are:

  • Most Millennials paying attention to presidential election, but far fewer to congressional elections
  • 30% of Clinton supporters contacted by campaigns, 28% of young Trump supporters contacted, 70% not contacted at all

Contact is important because it gives the recipients information and motivation to vote. These contact rates are disturbing low–and also uneven by region, gender, and party. Young men who live in battleground states have been contacted at nearly twice the rate of young women in “safe” states (38% vs. 20%).

Among likely young voters, Clinton beat Trump by 21 points (49% vs. 28%) in this poll, which was conducted between September 21 and October 3, 2016. USA Today/Rock the Vote released a youth poll yesterday that put the margin at 68%/20%. I’m not sure whether that difference results from methodological choices, such as the way the surveys define likely voters and present third-party candidates; but it is interesting that USA Today/RtV were in the field on October 11-13. The difference could therefore suggest a substantial improvement in Clinton’s margin since September.

The CIRCLE release presents additional information about young people’s attitudes, including this chart that compares the words that Trump supporters and Clinton supporters used to describe their own favored candidate.

Multivariate Network Exploration and Presentation

In “Multivariate Network Exploration and Presentation,” authors Stef van den Elzen and Jarke J. van Wijk introduce an approach they call “Detail to Overview via Selections and Aggregations,” or DOSA. I was going to make fun of them for naming their approach after a delicious south Indian dish, but since they comment that their name “resonates with our aim to combine existing ingredients into a tasteful result,” I’ll have to just leave it there.

The DOSA approach – and now I am hungry – aims to allow a user to explore the complex interplay between network topology and node attributes. For example, in company email data, you may wish to simultaneously examine assortativity by gender and department over time. That is, you may need to consider both structure and multivariate data.

This is a non-trivial problem, and I particularly appreciated van den Elzen and van Wijk’s practical framing of why this is a problem:

“Multivariate networks are commonly visualized using node-link diagrams for structural analysis. However, node-link diagrams do not scale to large numbers of nodes and links and users regularly end up with hairball-like visualizations. The multivariate data associated with the nodes and links are encoded using visual variables like color, size, shape or small visualization glyphs. From the hairball-like visualizations no network exploration or analysis is possible and no insights are gained or even worse, false conclusions are drawn due to clutter and overdraw.”

YES. From my own experience, I can attest that this is a problem.

So what do we do about it?

The authors suggest a multi-pronged approach which allows non-expert users to select nodes and edges of interest, simultaneously see a detail and infographic-like overview, and to examine the aggregated attributes of a selection.

Overall, this approach looks really cool and very helpful. (The paper did win the “best paper” award at the IEEE Information Visualization 2014 Conference, so perhaps that shouldn’t be that surprising.) I was a little disappointed that I couldn’t find the GUI implementation of this approach online, though, which makes it a little hard to judge how useful the tool really is.

From their screenshots and online video, however, I find that while this is a really valiant effort to tackle a difficult problem, there is still more work to do in this area. The challenge with visualizing complex networks is indeed that they are complex, and while DOSA gives a user some control over how to filter and interact with this complexity, there is still a whole lot going on.

While I appreciate the inclusion of examples and use cases, I would have also liked to see a user design study evaluating how well their tool met their goal of providing a navigation and exploration tool for non-experts. I also think that the issues of scalability with respect to attributes and selection that they raise in the limitations section are important topics which, while reasonably beyond the scope of this paper, ought to be tackled in future work.

facebooktwittergoogle_plusredditlinkedintumblrmail

More Upcoming FCSS Conference Sessions

Don’t forget that the FCSS Conference comes soon! In our last post, we highlighted some interesting conference sessions that may be of interest to a wide variety of audiences. So how about we take a look at some more intriguing sessions!

Saturday Morning, Concurrent Session One

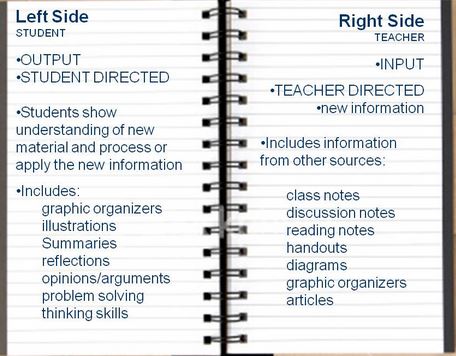
Making Connections in CIVICS with the Interactive Notebook, Patricia Kroeger, Destin Middle School,Okaloosa County Public Schools

Teachers will learn Interactive Notebook strategies that connect student learning to the benchmark essential questions, practice test-taking strategies, and connect currentevents to concepts of government.
Note: as a civics educator, this sounds fantastic. always looking for new ways to approach instruction!

interactives


Saturday Afternoon, Concurrent Session Two

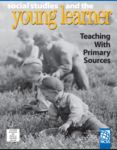
Publishing in Social Studies Journals, Dr. Scott M. Waring, University of Central Florida

The presenter edits several social studies journals (Social Studies and the Young Learner, CITE –Social Studies, and Social Studies Research and Practice). He will discuss the process of publishing in various social studies journals.
Note: This is a great opportunity to learn how to provide service to the field!

ssyl sw cite
Saturday Afternoon, Concurrent Session 3

Preparing Teachers to Meet the Holocaust Mandate in Elementary Grades Ilene Allgood & Rachayita Shah, Florida Atlantic University, Maureen Carter, Palm Beach County Schools

A Genocide Studies Unit was developed for an undergraduate multicultural course, and studied for its effectiveness in preparing pre-service teachers to implement the State-mandated Holocaust curriculum in grades K-12th.

kids-holo

Two brothers sitting for a family portrait in the Kovno ghetto (one month before they were deported to the Majdanek extermination camp) from http://genocide.leadr.msu.edu/representing-the-children-of-the-holocaust/

 
Sunday Morning, Concurrent Session 5

What to Expect on January 20, 2017?      Terri Susan Fine, University of Central Florida/ Florida Joint Center for Citizenship

What happens during the first year of a new presidency? This session will address how the president uses the first 100 days of the new administration, organizing Congress, and connecting campaign promises to policy proposals.

wash-inaug

Oil painting of George Washington’s inauguration as the first President of the United States which took place on April 30, 1789. Encyclopedia Britannica, https://commons.wikimedia.org/wiki/File:Washington%27s_Inauguration.jpg


And of course please don’t forget the fantastic keynote we have lined up! Please be sure to register now! We look forward to seeing you in Orlando.
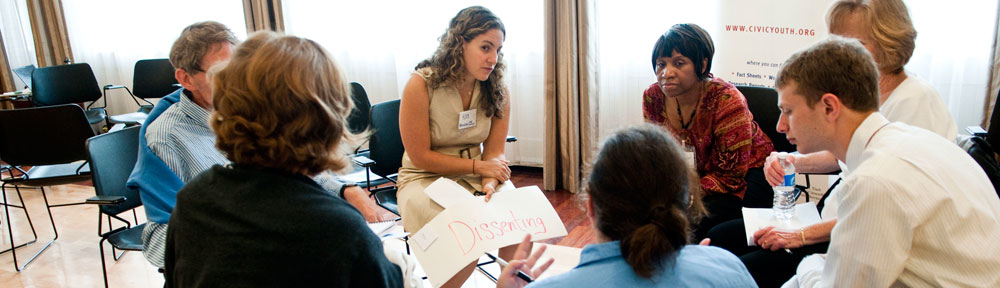